Industry related headlines to keep you in the know.
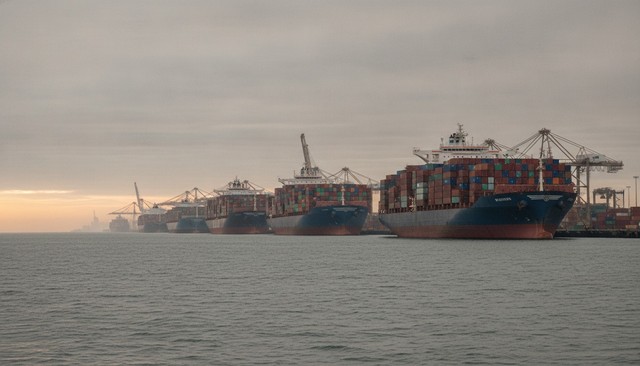
Vessels waiting for a berth at Durban Gateway Terminal spent an average of about 212 hours at anchorage in the four weeks to 10 September, and those that completed working spent a further 125 hours alongside. Together those two numbers describe a terminal where getting in is now harder than getting out.
Ports and Terminals
13 September 2026 • 4 min read
Durban Gateway Terminal handled 3 672 TEUs a day in the four weeks to 10 September, 30.5% below the 5 286 a day it managed over the preceding four months. The anchorage queue is shortening, but the berth productivity behind it has not recovered - and that gap is what decides whether a booked slot turns into a moved box.
The latest Busa Cargo Movement Update, compiled by the Southern African Association of Freight Forwarders, separates the time a ship spends waiting for a berth from the time it spends working at one. At Durban Gateway Terminal both are elevated: roughly 212 hours at anchorage before securing a berth, and roughly 125 hours alongside once it has one. Waterside volumes over the period came in at about 63% of the same four weeks in 2025.
Those two figures fail in different ways and call for different responses. Anchorage hours are a queueing problem - too many ships chasing too few working berths. Hours alongside are a productivity problem - cranes, labour, equipment availability and stack access. A shorter queue caused by diverted ships rather than faster working does nothing for the second number, and it is the second number that governs how quickly containers become available to collect.
Throughput gap: DGT averaged 3 672 TEUs a day from 14 August to 10 September 2026, against 5 286 TEUs a day from 14 April to 13 August - a decline of 30.5%. (Source: SAAFF Busa Cargo Movement Update, via Freight News, 2026)
The anchorage queue fell from ten vessels on 7 September to five on 10 September. SAAFF was explicit that this had not yet translated into a sustained recovery in terminal performance. By 10 September roughly 11 550 containers had been diverted to relieve pressure, with further diversion and network-management measures continuing. A queue that shortens because boxes went somewhere else is a redistribution of the problem, not a solution to it.
Inside the terminal the stack tells the same story. Overall occupancy moved from 60.8% on 7 September to 64.4% on 9 September before easing to 63.2%, while road import containers on hand climbed about 11%, from 3 968 to 4 421. Refrigerated cargo was tighter still, with reefer occupancy at 106% on 9 September easing to 102% the following day. Gate activity averaged about 2 147 moves a day between 7 and 10 September, ranging from 1 867 to 2 552, and rail evacuation was uneven across the period.
Durban is frequently discussed as a single performance number, and the same update shows why that is misleading. Pier 1 handled 97% of its targeted volume, with vessels waiting an average of 51 hours at anchorage and spending 77 hours at berth. The Durban Multi-Purpose Terminal recorded a 158% week-on-week increase in waterside volumes and exceeded its target by 118%, although vessel waiting times there still averaged 89 hours.
For a cargo owner, that spread is actionable information rather than trivia. A box routed to Pier 1 and a box routed to DGT in the same week are not carrying the same delay risk, and a break-bulk or multi-purpose consignment is operating on a different curve again. Where a service or a carrier gives a choice of terminal within Durban, the terminal is now a material variable in the lead time, not an administrative detail buried in the booking.
Ask the forwarder or carrier which Durban terminal the vessel is working, and price the leg off that terminal's current berth performance rather than a port-wide average. Watch hours alongside rather than the anchorage count, because that is the number that predicts when a container becomes collectable. Reefer cargo deserves its own contingency: occupancy above 100% means plugs are being managed by exception, and a missed connection there is a total loss rather than a delay.
Stay connected with Southern Africa's freight and transport community.
Join 6,400+ logistics professionals across the SADC region.
Visit Laaimylorrie.com| About the Author | |

|
Andre Klynsmith Entrepreneur & Technology Enthusiast Andre's expertise spans technology, blockchain, transport, and logistics - with a passion for innovation and driving positive change across industries. |
| Source: Freight News View source › | 11 September 2026 |


Subscribe to our Newsletter and stay in the know with all the latest Industry News, Products and Trends covering the whole of the SADC region.
KS Blockchain T/A Laaimylorrie.com . All Rights Reserved.